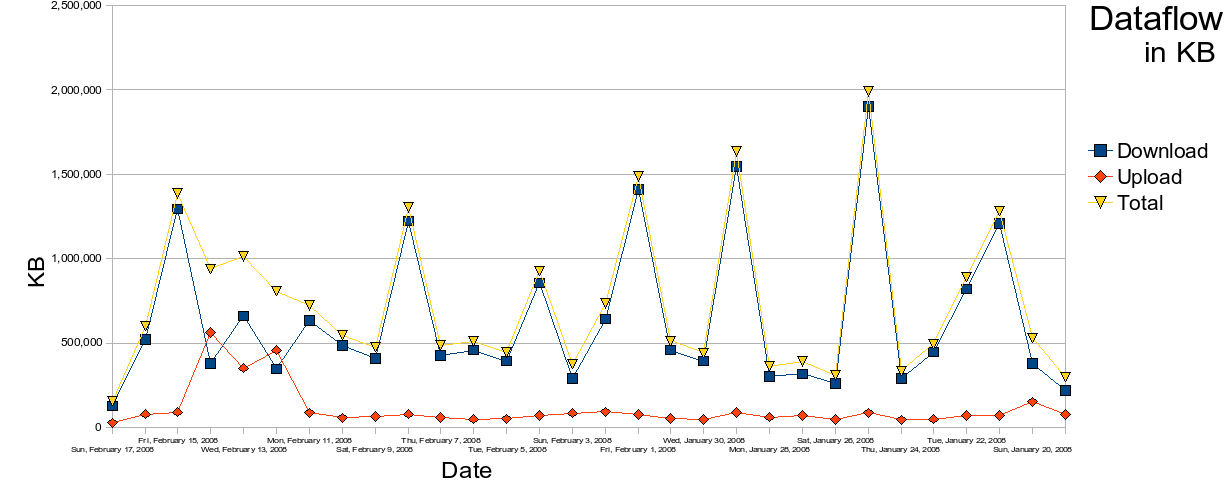
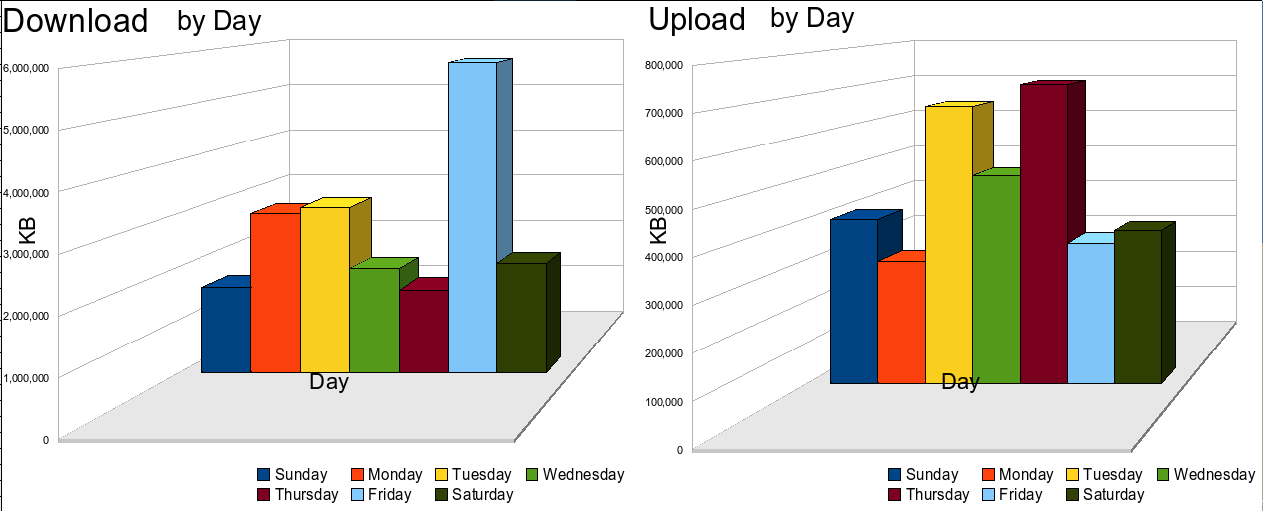
I said that I would post some of the data that I gathered via my tomato firmware that I installed one month ago. Here are some pretty graphs. So far it looks like I run at a total of about 21 – 22 GB of data up and down per month. I think that I will try to collect this data over the year and collect stats. My next post on this will be in two more months after three months of full data has been collected.
It should be noted that, though the data is pulled from the interface the graphs were created with OpenOffice for more detail.